
Technology significantly influences human behavior. Needless to say, the rise in digital payments, e-commerce & banking frauds is an outcome of the heightened community’s dependence on the Internet, especially online shopping. The attackers can steal the identity or bank/card relevant information, which can incur revenue loss and cause reputational damage to the businesses, especially if the hacker imitates the online store. The article discusses how to detect fraud transactions and what advanced technologies to use to detect and prevent them.
-
The overall motive of the fraudulent transactions is to steal user’s debit or credit card information and their identity.
-
Checking transaction patterns and requiring CVV might help you detect potential fraud early and prevent its adverse effects.
-
Advanced technologies like blockchain or payment tokenization can maximize the credibility of your store and secure online transactions.
Common Types of Fraud in Transactions
Fraudulent actions can cause considerable financial loss to businesses based on illegal digital thefts. However, prior to detecting fraudulent transactions, it is important to decode their causative factors or the types of fraud.
Phishing
Phishing is a type of cybercrime that is based on e-mail or SMS spam messages. The key motive is to make the user provide sensitive data, like information about bank account, credit card, or personality identifiable info. The culprit can utilize the following tactics that denote it’s a phishing cyberattack:
-
Hyperlinks. Frauds can include hyperlinks, for instance, to a reputable store, to create a sense of credibility. The user might be eager to pay for a subscription, so when they click on the link, the attacker gains access to their bank account. From a business standpoint, it will lead to revenue loss based on the reputational damage.
-
A Sense of Urgency. Hackers can send messages about hot deals from a so-called clone of a reputable store to create a sense of urgency by manipulating the limited time or product availability. So, when the user clicks and pays for the item, their bank account or card information is stolen.
MTIM
MTIM, or Man-in-the-Middle attack, occurs when the attacker intercepts the communication between the client and your online store. The motives include financial data theft, login data theft, and identity theft. Here is a step-by-step explanation of how MTIM works:
-
The attacker creates a free fake WiFi hotspot and intercepts the data transmitted between the user and the store.
-
Then, the fraud decrypts the secure (HTTPS) connection by substituting it with a fake (HTTP) credential or using a fraudulent SSL certificate to imitate the store.
-
The final stage is redirection. When creating a fake store, the original online retailer will lose revenue, as the attacker will imitate it by stealing the client’s payment for the item.
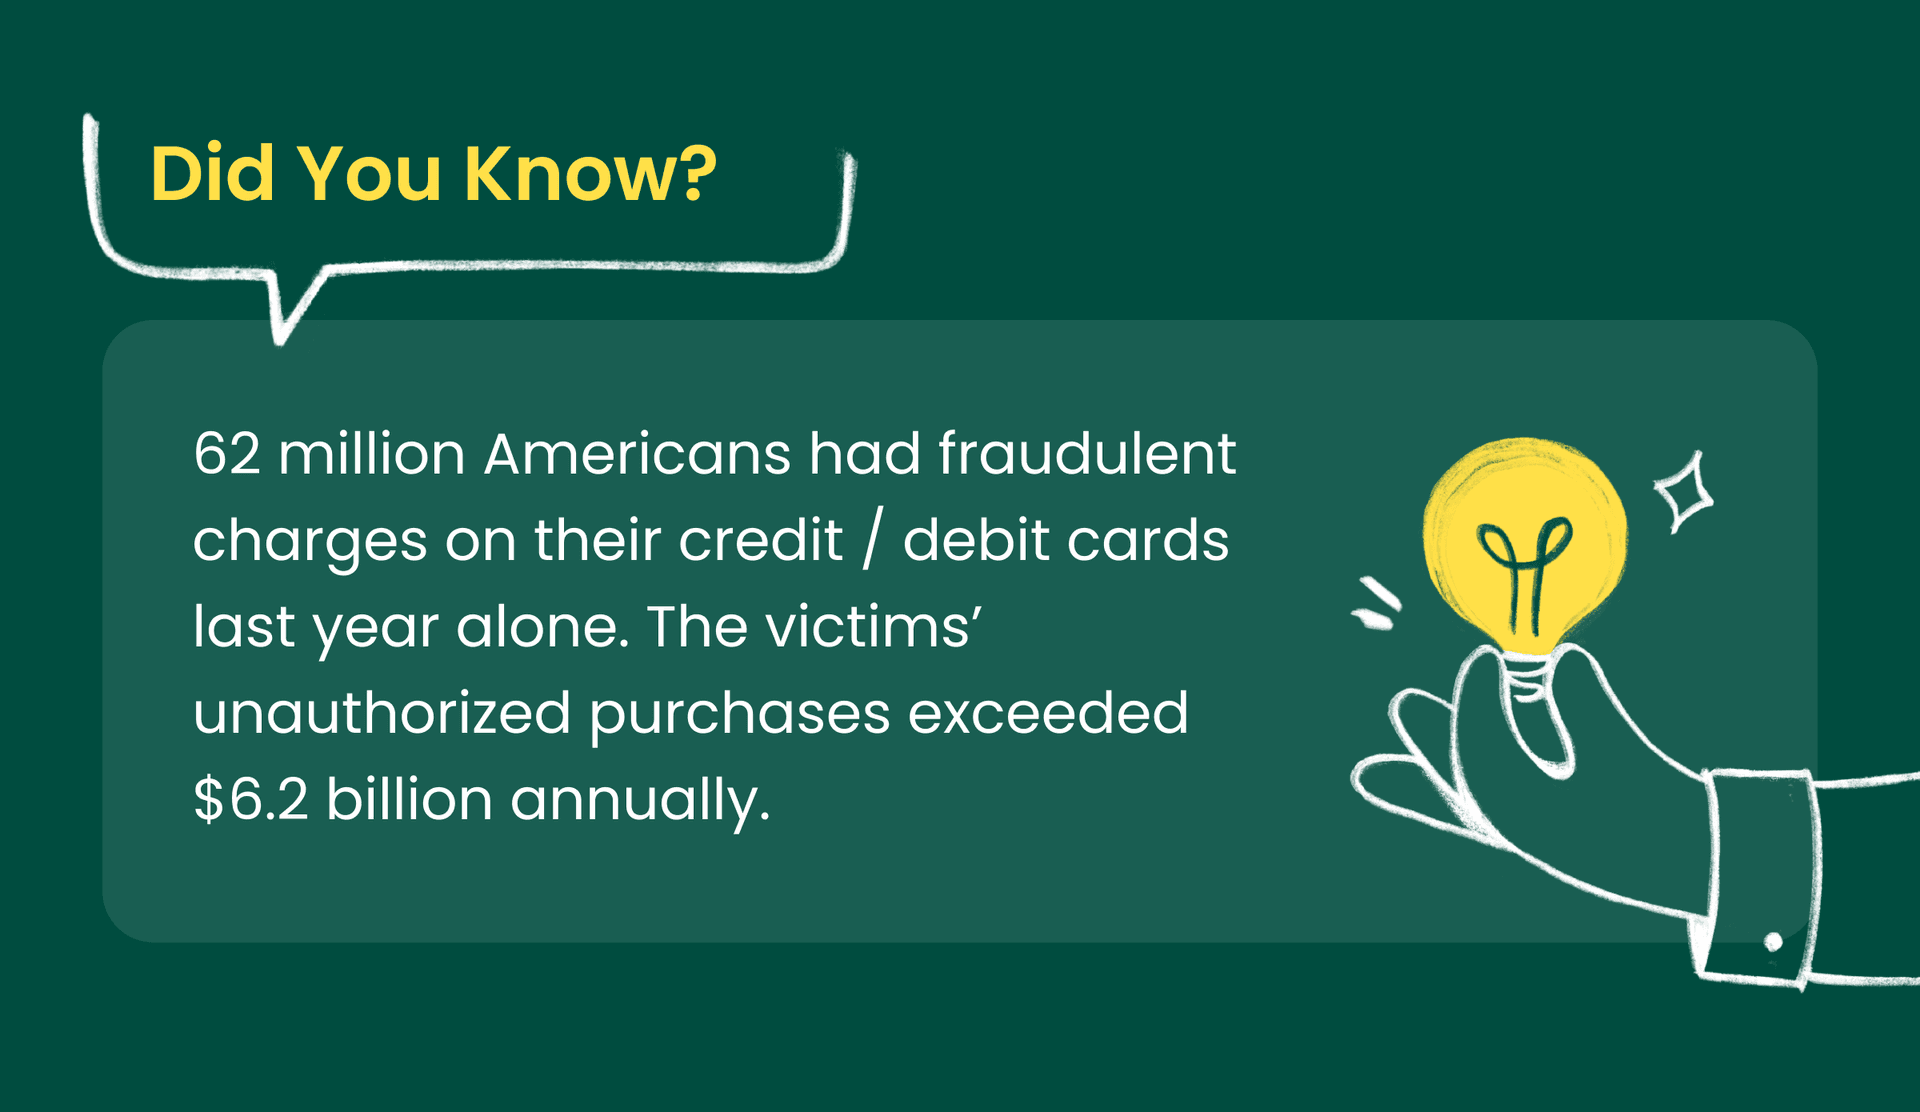
Source: https://www.security.org/digital-safety/credit-card-fraud-report/
Chargeback Fraud Scams
Chargeback fraud scams are based on the user’s manipulation of online purchases, which make the online retailer refund the item.
-
The client makes a purchase using their debit/credit card.
-
When receiving the item, they dispute the store by providing misleading info about the damaged item.
-
The bank analyzes the case and issues a refund by debiting a retailer’s account, which leads to an unjustified chargeback.
DDoS
In a DDoS (Distributed Denial of Service) attack, the attacker disrupts the normal functioning of the services of an online business by flooding them with a huge load of Internet traffic. By slowing down the website's performance, the merchant will incur financial losses because the users will not be able to open it and make purchases.
Key Indicators of Fraudulent Transactions
If you are interested in analyzing the ways how to detect fraudulent transactions, you have to keep in mind the indicators of potential falsified transactions. Why does it matter? That’s because the indicators serve as red flags that signalize potential threats in the overall payment initiation and its potential proceeding. Here are the factors of fraudulent transactions.
Mismatched Information
The first element of this fraudulent translation indicator is the mismatched billing and shipping addresses. You might want to keep an eye on the cases where the billing address differs from the shipment, which can be a scam indicator. Moreover, if the purchase is made with a VPN, this can be decoded as a high-risk country.
Suspicious User Behavior
Sub-aspects of suspicious user behavior can be grouped into a few main categories. The first one is an unusually large order when the purchase contains many more items than the average user. This leads to the second sub-aspect, which is unusual purchasing patterns. The user buys items in bulk, like electronics (which can be resold afterward). The third sub-element of this fraudulent transaction indicator is multiple repeated payment attempts. The multiple payment failures and retries with different card use is a significator of the fraudulent transaction.
Payment Inconsistencies
Payment inconsistencies comprise the elements of high decline rates, multiple cards for one account, and multiple orders in a short time. Multiple declined attempts from the same user with the same card to complete the purchase is a risk factor for fraudulent transactions. Another indicator of a fraudulent transaction is when one user applies multiple credit cards to make a purchase. This might symbolize an identity theft. The final indicator of a fraudulent transaction is when the user from the same IP address places several orders in rapid succession.
How to Detect Fraud in Online Transactions Early: Tips for Businesses
We’d like to recommend the following tips on online transaction fraud detection, considering the analyzed indicators and their sub-elements.
-
Implement Fraud Detection Tools
Utilize tools like FraudLabs Pro, Kount, Sift, etc., as they can check the transaction patterns and will mark the suspicious ones in real time.
-
Check Transaction Patterns
In order to maximize the effectiveness of fraud detection in online transactions, establish alerts for misleading patterns like high-value orders and multiple orders made from the same IP address within a short time. Additionally, check the chargeback ratio because if it’s high then it’s a sign of fraud.
-
Apply Geolocation and Device Fingerprinting
You can apply geolocation tools to monitor the client’s actual shipping and billing addresses to verify their credibility. Device fingerprinting might be a useful tool to detect repeat offenders even if they disguise themselves using multiple accounts.
-
Require CVV
You can detect and minimize fraud attempts by requiring the clients to enter their CVV. This strategy will be helpful in reducing the frequent failed payment attempts.
-
Integrate the Two-Factor Authentication (2FA)
You can add an extra security layer to the transaction by requiring the clients to verify their identity by sending an SMS code or e-mail message.
Advanced Techniques to Detect Fraud Transactions
As technologies keep evolving, so do attackers. So, in order to know how to detect online transaction fraud, you should keep in mind the following methods of transaction payment detection and prevention.
Artificial Intelligence & Machine Learning
AI and ML implement behavioral analysis, supervised and unsupervised learning, and real-time scoring to detect fraud transactions. AI models analyze transaction patterns and mark anomalies, like unusual spending patterns or locations. Artificial Intelligence trains on historical fraud information to detect and decode similar behavior in the new transaction cases. In unsupervised learning, AI detects outliers without previous fraud examples. Finally, real-time scoring marks a transaction with a particular risk score based on factors like user history and location.
Biometrics and Identity Verification
Biometrics and identity verification implement the technologies of behavioral biometrics, facial and fingerprint recognition, and voice authentication. Overall, behavioral biometrics are an advanced technology in identifying transaction fraud because you can cross-check a user’s mouse movements, typing speed, and touch pressure for inconsistencies.
You can implement facial and fingerprint recognition to verify identity during login or high-value transactions, which can minimize unusual purchase patterns and minimize the repeated failed attempts to pay for the item.
You can consider voice recognition for iOS and Android-based payment transactions to verify a user’s identity and eradicate data theft.
Payment Tokenization
You can implement a payment tokenization method to limit the possibility of payment fraud emergence. Payment tokenization replaces users' sensitive data, like card numbers, with a secure context that can be applied only to specific contents and be valid only for specific merchants.
Blockchain Technology
Blockchain technology provides a secure and tamper-proof way to create a permanent record of online payment transactions and functions as an immutable and irreversible ledger. Smart contracts, along with the blockchain, ensure automatic verification of transactions and compliance with the previously established parameters.

Social Media and Dark Web Analysis
When the cardholder applies different cards for purchases, you should monitor suspicious activities like stolen credentials to gain access to the user’s account. Another way of fraud detection in online transaction is dark web scanning, as this methodology can help you check whether a client’s payment data is being sold or placed via the web.
Graph Analysis
You can incorporate graph-based analysis to detect the patterns of interconnectedness in fraudulent activities, like IP addresses or related accounts. Additionally, graph analysis uncovers the linkage between the unrelated entities, which identifies fraud rings.
Contextual Data Analysis
Contextual data analysis might become an indispensable approach to detecting and preventing fraud in payment transactions. The approach applies user context analysis by analyzing the client’s contextual info, like the time of the day and what type of device they use. Additionally, what maximizes the effectiveness of this fraud-preventive measure is that it creates a detailed profile by utilizing data on the user’s historical behavior, which is helpful in detecting unusual activities.
How Agilie Used Data Analytics to Detect Fraudulent Transactions
Agilie is a European IT outsourcing company that crafts unique from scratch or optimized digital solutions aligning with the needs of different industries such as fintech, real estate, healthcare, logistics, marketplace, & e-commerce.
One of our significant cases of fraud detection was Givingli, an e-commerce personalized greeting card maker app. The software experienced the influx of new users and retained its clients via cooperation with multiple companies for gift certificates, which made it a tempting bait for attackers.
The fraud cases represented DDoS attacks and culprits’ manipulation with ‘cheap’ gift certificates. In order to ensure a decent level of upcoming transaction fraud detection, our development team implemented the following data analysis strategies:
-
Firewall let us block unauthorized access to the open ports.
-
Key encryption strengthened authentication and authorization.
-
New Relic restricted the number of user requests. Additionally, this security measure monitored the system under a load of request volumes and generated alerts on suspicious user behavior, including multiple reentrancy attempts.
 Learn more about Givingli and our tech experience on the project.
Conclusion
The article discussed different types of manipulative users’ and attackers’ behaviors during online shopping and illustrated how to prevent fraudulent transactions. DDoS attacks, chargeback scams, MTIM, and phising are only a few cases of breaching the online transactions leading businesses to incur revenue losses and unjustified chargebacks. Hence, in order to know how to detect fraud transaction and resolve it, you can work with a reliable IT outsourcing partner compliant with robust security protocols.