
Mobile platforms serve multiple purposes - making money, connecting people, raising brand awareness, selling items and services, and many more. To ensure solutions live up to users’ expectations, proper monitoring and tracking certain metrics are mandatory, helping applications enhance efficiently. Every service to be demanded has to evolve constantly.
How to define what aspects require urgent upgrades?
We’d like to share with you the most important app metrics every company should better be tracing to keep their software healthy, strong and successful. Monitoring results help entrepreneurs understand clients better, strengthen service performance, and boost retention at different stages of app life spans.
We’ll discuss metrics to measure engagement, satisfaction, performance and income indications. Let’s get down to business.
Engagement
Did you know, statistically, 25% of all applications downloaded get applied just once?
Today’s competition is tough, thus, it’s vital to track usage and engagement metrics to realize the way your audience engages with a platform, and how to encourage individuals to use your resource more.
Let’s review what critical metrics for measuring users’ engagement you shall keep an eye on.
Number of downloads
Downloadings serve to be a reliable criterion for measuring app success. It’s an excellent engagement metric. Whenever your service is uploaded and installed on a specific gadget, it’ll be accounted to your downloading rate.
Such an app downloads tracker is to reflect the way your audience reacts to your business branding and the marketing strategies you implement. The higher the downloads number goes, the greater the customers’ response is.
Conversely, not gaining lots of downloads means it’s time to redefine your marketing tools to enhance the given important indication.
To better your app metrics for engagement take a closer look at your platform name, characterization, program icon, key terms, and the like. Keep in mind, the App Store algorithms diverge from the Google Play criteria, so take actions accordingly.
If customers upload the application from both those platforms, remember to monitor the mentioned mobile app metrics on each. Is your service in demand in App Store? If yes, still, such a fact doesn’t lead to its popularity on Google Play, and vice versa.
Tracking number of downloads
Google Analytics is a reliable instrument to trace certain metrics, say, downloading & installing rates. Detailed instructions would guide you in the process.

Active users
Here’s the following important mobile service metric.
Interesting thing: not every person who downloaded your resource turns to be an active user. Active users are believed to be the persons who are opening the program consistently and engaging with it systematically.
Tracking active app users is significant to figure out the level of application utility and effectiveness. Well, how to identify if a person is an active user or not? It’s all about analytical instruments you decide to apply.
Google Analytics claims an individual is an active user if he or she has set up and applied a service over the last thirty days.
The metric in question could be classified into two subcategories: Daily Active Users and Monthly Active Users.
Daily Active Users, or, simply put, DAU, refer to the number of customers who enjoy your platform features a minimum one time a day. And, Monthly Active Users, in short, MAU, represent the quantity of clients applying your program minimum one time a month.
Tracking active users
The majority of analytical instruments available make it possible to track diverse usage and engagement metrics, including DAU & MAU. Here’s the Google Analytics example.
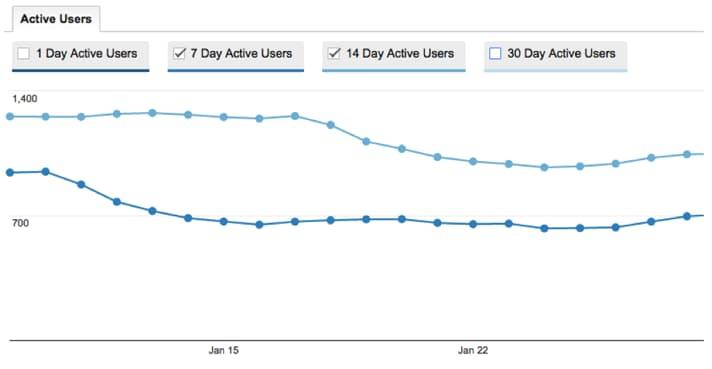
As you see from this graph, you can filter the page to see the quantity of unique visitors who applied the app or the site over a specific time period.
Session intervals
You should consider session intervals to be one of the most important app metrics to trace. The benchmark indicates the amount of time between every case when a person opens an application to use it. Eventually, the given indicator reveals how often the audience liaises with a certain solution.
While following up on this type of metric, you’ll find ways to improve the performance of your app by optimizing your clients’ experience. Thus, you could easily motivate your people to take advantage of your site more frequently.
Let’s say, the metric measures cell phone users to prefer longer intervals in between the app usage compared to tablet users. It would mean you need to adjust the particular characteristics of your mobile application - like, screenflow, navigation, etc. - to encourage your customers to open it more often.
Maybe it’s time to include a push notification system as part of your retention techniques? Such a move could build more engaging communication with your people.
Tracking session intervals
There exist particular instruments you could take advantage of to monitor. Google Analytics is a great examples to apply, and AWS Mobile Analytics is a decent solution as well.
Average usage time
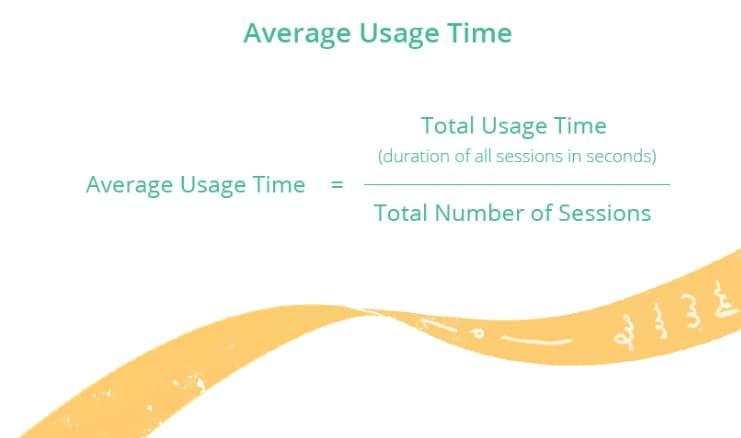
If you want to know what are mobile application metrics to trace the timing people are spending in a program, check out the given engagement metrics. It’s designed to trace the average time period during which a person applies a solution.
The mentioned business metric could be applicable to assess usage tendencies, let’s say, to see if a specific group of clients is constantly using your service over a sustained period.
Why would you need those details? The data helps you determine what exactly people do, say, purchasing or researching. And, having such info you could plan further upgrades to better respond to the needs of your clients. Then, in-application experience gets significantly enhanced. From such a perspective, this metric for engagement turns to be extremely valuable.
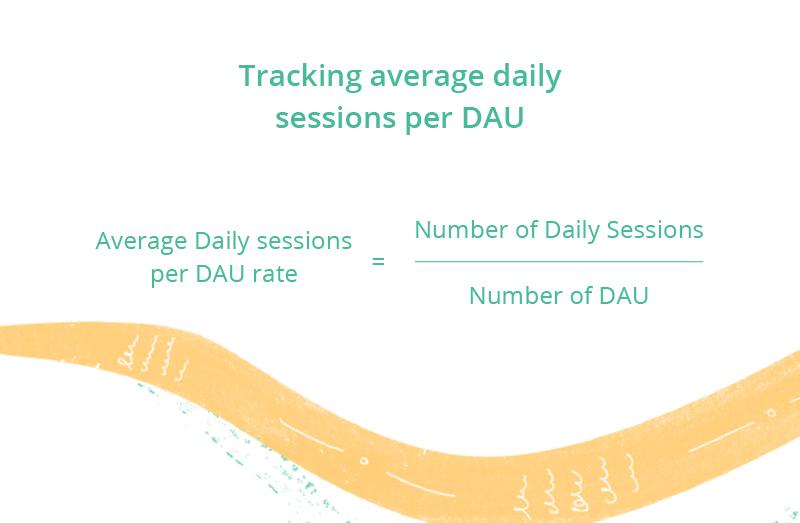
Average daily sessions per Daily Active User (DAU)
It’s clear from its name, given mobile service metric is employed to specify how often your DAU enjoy your platform, thus, here’s one more benchmark to measure your success. However, the engagement rate in question could be used in a few markets only, e.g. social media programs and eCommerce applications.
Please note, if you see customers open your solution one time a day only, it doesn’t suppose to mean users aren’t engaged enough. When we’re talking about online shopping services, every individual hardly purchases on a daily basis.
Even in case of social media platforms, this mobile application metrics might not be the most suitable choice, and, let’s say, average session duration would work more effectively to demonstrate app owners if they provide the content their clients expect.
Churn rates
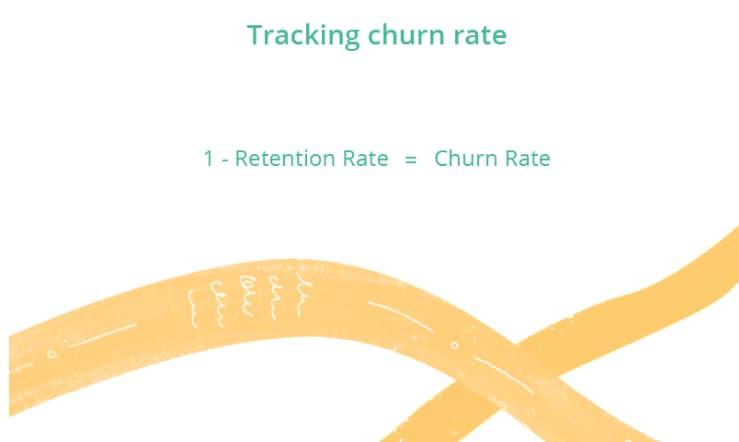
Such an important m-service metric is completely opposing the retention benchmark which we’ll review in a little while. The churn rate measures your app uninstalling and unsubscription level.
As you can tell, the high churn rate isn’t what you actually need. However, it may turn even worse, if your most loyal and precious - meaning, profit-generating - clients decide to churn. Such an unwelcome phenomenon will have adverse consequences for your business.
By all means, increasing Churn Rates are harmful, no matter what market segment you’re operating in. Though, the greatest challenge with the given business metric is that it’s quite tough to identify reasons your people decide to leave forever. It might happen due to usability decrease, lack of fresh content, moving to competitors, experiencing technical issues, say, crashes, and so on.
Abandonment rates
Don’t confuse the abandonment rate with the previous one, since those are two different indications, despite the fact they both track usage and engagement metrics. A program is believed to be abandoned by a person who has installed it, but hasn’t applied it even once or has never signed up.
Would you like to improve the way your mobile app performs in this regard? Deeply examine your introducing steps, as well as the signing in procedures to find out how to make them faster, smoother and easier.
Apparently, a user had a particular interest in an application to get it downloaded, however, something has prevented him or her from using it. Maybe it’s about the data you request from the audience to move further? It wouldn’t be smart to ask customers too personal data so they could navigate a resource.
The best decision would be to return to your drawings, and try to upgrade and facilitate the sign-up procedures if experiencing an elevated abandonment rate.

Tracking abandonment rates
Google Analytics shall come to the rescue once again to capture your abandonment rate.
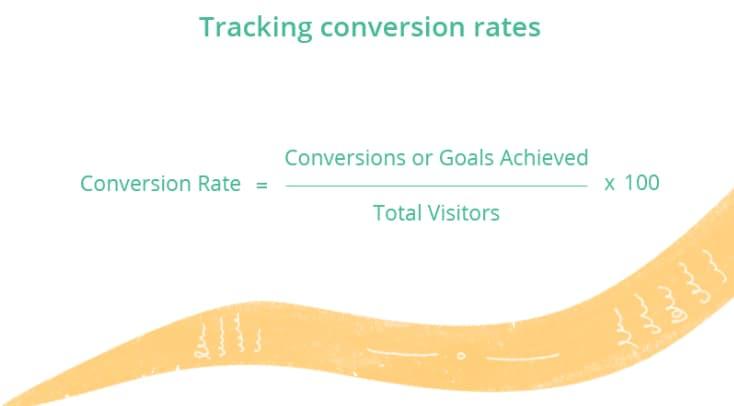
Conversion rates
Such a benchmark serves to track certain metrics helping you weigh your gains.
Wondering how to profit from the online resource you own? Call some attention to your conversion policy. When planning to make money on in-application purchasing and subscription, find ways to build those processes simple and clear for the audience.
If it takes multiple clicks and numerous page searchings for an individual to order an item via your site, most likely a person would abandon the process halfway through without generating a single dollar for you.
Why don’t you review every phase your customers go through from the original acquisition and up to the ultimate conversion? Try to keep those steps simple and straightforward.
It’s essential to determine what specific points and stages cause the greatest abandonment. Then, you’ll know what to stay focused on in the first place. As soon as you resolve those issues, you’ll find your conversion rate grow.

Acquisition cost
This type of metric shows the amount of money you spent on every download of your app. And, naturally, you’d like given a number to be the lowest possible. Heightened acquisition expenditures could easily empty your pockets fast.
It’s vital to track acquisition metrics to find out how you’re doing.
The secret to decreasing this number is to budget and plan properly. The key reason why you should track app acquisition costs is to define adequate attribution channels to boost your downloads.
At the very start to see how your mobile app performs, download numbers and your conversions figure are sufficient. However, at some point you’ll want more concrete figures on the expenses to attract wider audience, thus, enjoy cost per acquisition metrics.

Event tracking
This important mobile metric evaluates your clients’ in-application experience. When striving to improve the performance of your resource, try to clarify what exactly people do while enjoying the resource.
Ideally, the objective is to identify what specific buttons the audience is clicking being on a particular page.
While tracing distinctive events, app owners get details to enhance their app efficiency with every next upgrade. Would you like to take advantage of such a tool as well?
Tracking events
Google Analytics is applicable to monitor multiple metrics, and event tracking is on its list as well.
Retention rates
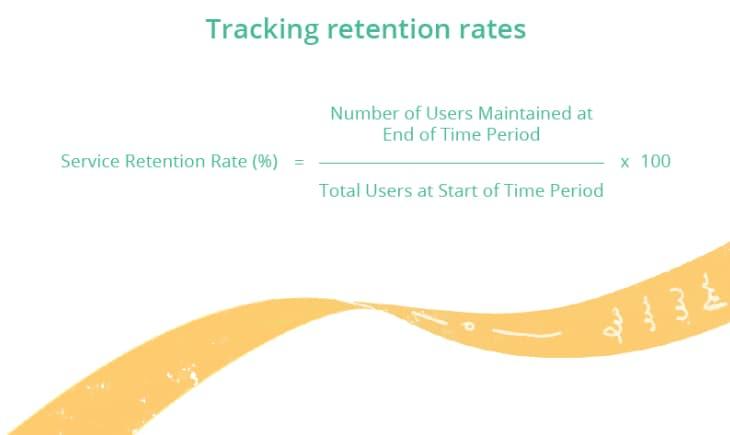
We’ve mentioned retention rate earlier, remember? And this time let’s devote more attention to such a character that belongs to the most important app metrics.
The retention rate serves to assess the usefulness of your online resource. Don’t expect every user who applies your service to get very much involved, however, those individuals may still seek help from your platform when in need. It’s exactly what retention rate is about - a number of persons who decide to revisit the program minimum once after having installed it, throughout a specified time interval, of course.
Some marketers believe it’s wiser to focus on retention metrics rather than on acquisition parameter, since the first one doesn’t require any expenses, as compared with marketing costs acquisition strategy demands.
A great idea would be to track retentions every month, quarter and year. Say, you’re launching the latest application upgrade, thus, it’s better to check how the audience would appreciate those innovations.
After having discussed the key app metrics for engagement, we proceed to the following cluster.
Satisfaction
It’s significant to attract and engage clients. But to turn them into your regular customers you have to make them happy with a platform they apply.
Following up the below-mentioned mobile app KPIs shall help you figure out users’ satisfaction level to encourage people to use your platform more.
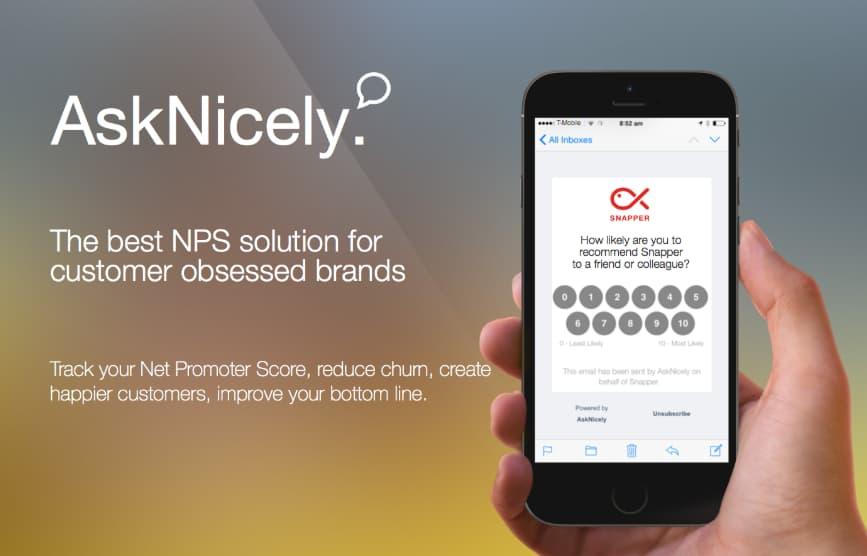
NPS (net promoter score)
The phenomenon of a net promoter score is a kind of viral success. This particular business metric captures chances you have that a person applying your service will reference it to his/her family members and friends.
Certainly, every app creator is dreaming to keep NPS as high as possible. It’s not too difficult to manage - simply give priority to your user connections incorporating them into your platform principal functionalities.
Tracking NPS
One of the greatest ideas is to measure your performance through ranking scales. Why don’t you merely ask your audience outright, just like Snapper Mobile does? It’s a pretty creative solution. Look!
App store reviews
It doesn’t make any sense to deny the fact that customers’ reviews, comments, and ratings have a bearing on the downloads number. It happens since potential downloaders prefer to look through comments to figure out whether other clients are enjoying specific program features.
Did you find some negative feedback? You better give serious consideration to those.
Such remarks might provide you with specific tips on what you could do to help your people enjoy their in-app experience more. By ignoring poor reviews you risk discouraging individuals from installing your application. Moreover, it would equally increase your churn rates.
Tracking app store reviews
AppFollow is an app analytics & reviews monitorer that is appropriate for all operating systems (Android & iOS).
In-app feedback
Clients’ feedback is similar to reviews, however, the first option gives valuable details only to you as an owner, and not to the general public.
Potential customers won’t see such remarks in the app store, but you - if taking those comments seriously - would manage to adjust online resources to make it better.
Tracking in-app feedback
Are you interested in getting feedback? You could request assistance from your audience again - send them to push notifications to find out their opinions. Then, users know you care about them.

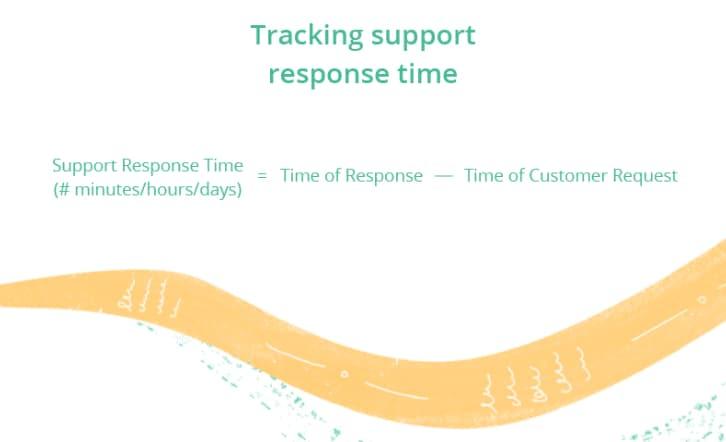
Support response times
Here’s one more mobile app metric to capture clients’ satisfaction levels. While measuring such an indicator, you receive a working tool to improve users’ experience.
Have you ever asked yourself how long your people have to wait to get the response from the app support staff? Sooner or later your audience will have an inquiry to file. So, what’s your site response timing?
To improve your app operation, the task is to conduct an in-depth analysis of clients’ support procedures.
Review your resource availability and contacting techniques. Additionally, check the quality of servicing provided. Simple steps introduced make persons happier encouraging them to keep enjoying the program.
Moving on, let’s examine the following types of metrics.
Performance
Continuous improvements are mandatory to keep a resource advanced and up-to-date. To improve the performance of your app, you’ll track certain metrics to evaluate your business effectiveness.
The indications below help you attain the desired.
Number of crashes
Such an indication is considered to be self-explanatory. It shows the breakdown of how many times a program gets crashed, so app holders would determine exactly what’s the matter with their application.
The support staff has to be conscientious while tracing those technical malfunctions to eliminate potential difficulties users might face when taking advantage of a site. Mentioned issues could also lead to data loss, therefore, it’s a big deal.
Occasionally, such an important mobile app metric would supply even much deeper details, say, what was the cost of a crash, whether it happened due to the upgrade, and so on.
Tracking number of crashes
Google Analytics is at your service to help you generate a report to obtain data on your crash level.
Speed
Such an important app benchmark measures solution loading speed, thus, it tracks certain metrics to evaluate the overall resource performance.
The indication reflects the amount of time various service functions need to load. Let’s say, how long it might take so searching features provide the results, and how long it would take so the following game level gets loaded.
Fast loading is critical, since it’ll make your users more involved, and long-time loadings, on the contrary, would frustrate customers triggering their abandonment.
Tracking speed
There’s a great variety of speed test solutions to keep records and capture a moment when your intervention is required.
And now we’ll continue with profitability metrics.
Income
Here we come to the most interesting types of metrics, the ones which help you generate profits. Take a look at those benchmarks to trace.
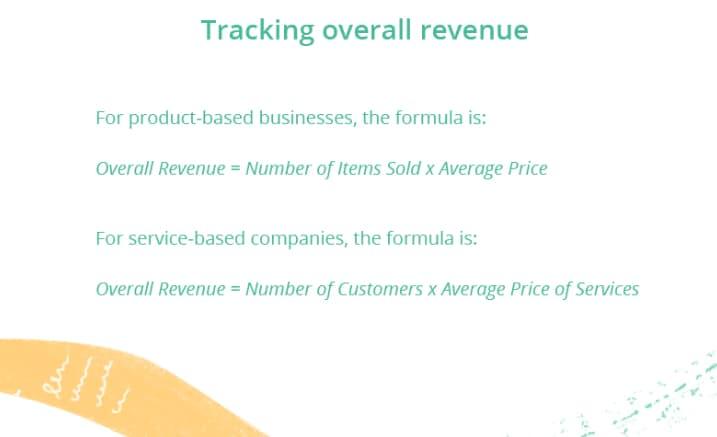
Overall revenue
What was your primary motivation to develop an online resource? Was it the desire to earn an income?
By monitoring your revenue you measure an app success to figure out if you achieve the desired. But how to understand what revenue level you must have to prove you’re successful?
First of all, you have to determine what you expect to receive and your goal has to be achievable. Think of what you’d like to earn, let’s say, in 3 months or in 6 months. Set some expectations for the next year. Following up your revenue indication is the way to define if your weekly and monthly income levels are bringing you towards goals set.
Are you interested in increasing incomes? Examine your revenue sources - say, in-application purchasing, ads, subscriptions, etc. - to identify which of them are generating the greatest profit, and focus your efforts and resources on those.
If some of those streams aren’t lucrative, maybe you shouldn’t waste your time on them? Or to make them be more profitable you have to refresh and innovate them.
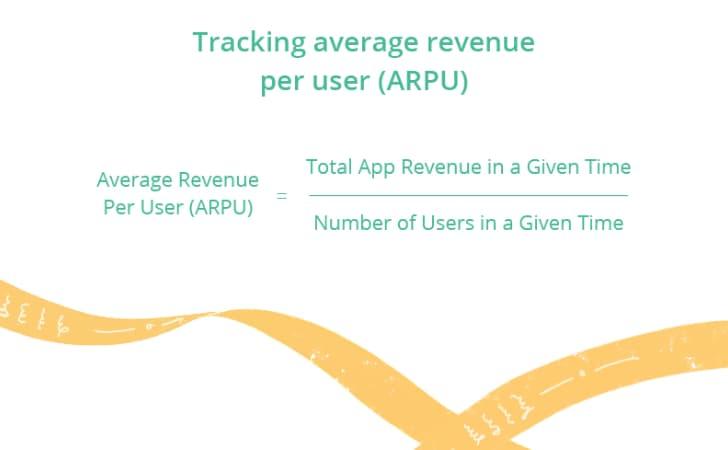
Average revenue per user
Present profitability reflecting metric - shortly, ARPU - exists to assess whether you achieve income targets, weekly, monthly or yearly ones. In simple terms, ARPU indicates income brought by your average clients.
On the other hand, such a parameter won’t manage to foresee the total income which a user could presumably generate for your enterprise during the life time.
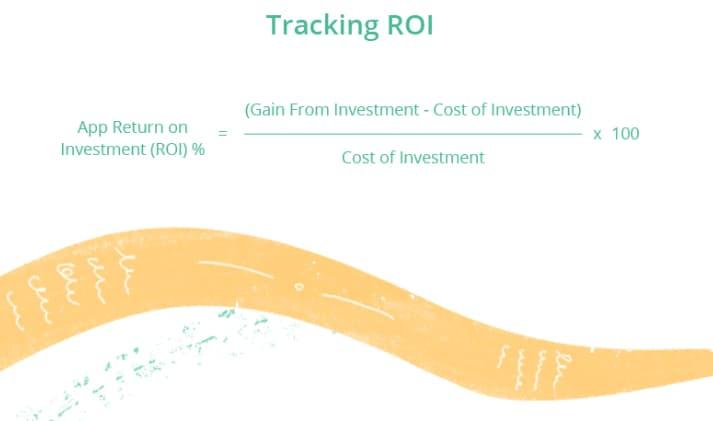
Return on investment (ROI)
The metric follows up the money you receive, so to speak, return, from the money spent while developing and promoting a platform.
When functioning in the mobile segment, collecting ROI is key to your brand succedings. ROI tells whether you receive the desired outcomes. Such an important mobile solution metric gives a hint, if you should change your strategies.
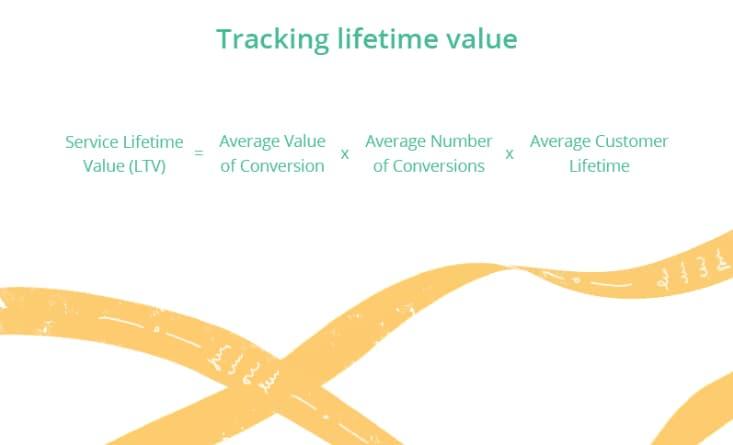
Lifetime value (LTV)
Last but not least, mentioned characteristic represents a profitability measuring metric to monitor revenues’ level. We’re talking about the financial parameter of a specific program and the worth of every individual who’s using a solution during his/her lifetime.
By means of acquisition channel, LTV is capable of reflecting growth - if there’s such - in various branches. The given parameter demonstrates what money to invest to attract more people, generating income, of course.
Tracking certain metrics regularly assists business owners to keep their brainchildren strong and healthy. Data obtained reveal areas of concern and room for improvement. Indeed, forward-looking entrepreneurs always remember, a demanded solution to resolve users’ issues and bring profits to its owners has to build strong involvement and individualized experiences.
However, not all of those metrics mentioned turn out to be applicable and useful for your business case. Thus, get an understanding of what you’re intending to obtain when monitoring those indicators. It’s critical to learn your segment standards and requirements before getting down to the measurements.